Export a diagram
Take the topology somewhere else: a slide, a Grafana dashboard, a wiki page, or your own documentation.
| You want | Use |
|---|---|
| An exact picture of the canvas | SVG |
| A live traffic map in Grafana | Grafana bundle |
| An editable diagram | Draw.io |
| An interactive topology in your docs | The viewer |
SVG
Capture Viewport as SVG in the toolbar opens Export SVG. It exports what you see, including your styles, groups, and text. Choose the zoom, padding, background, and whether to include annotations and interface labels.
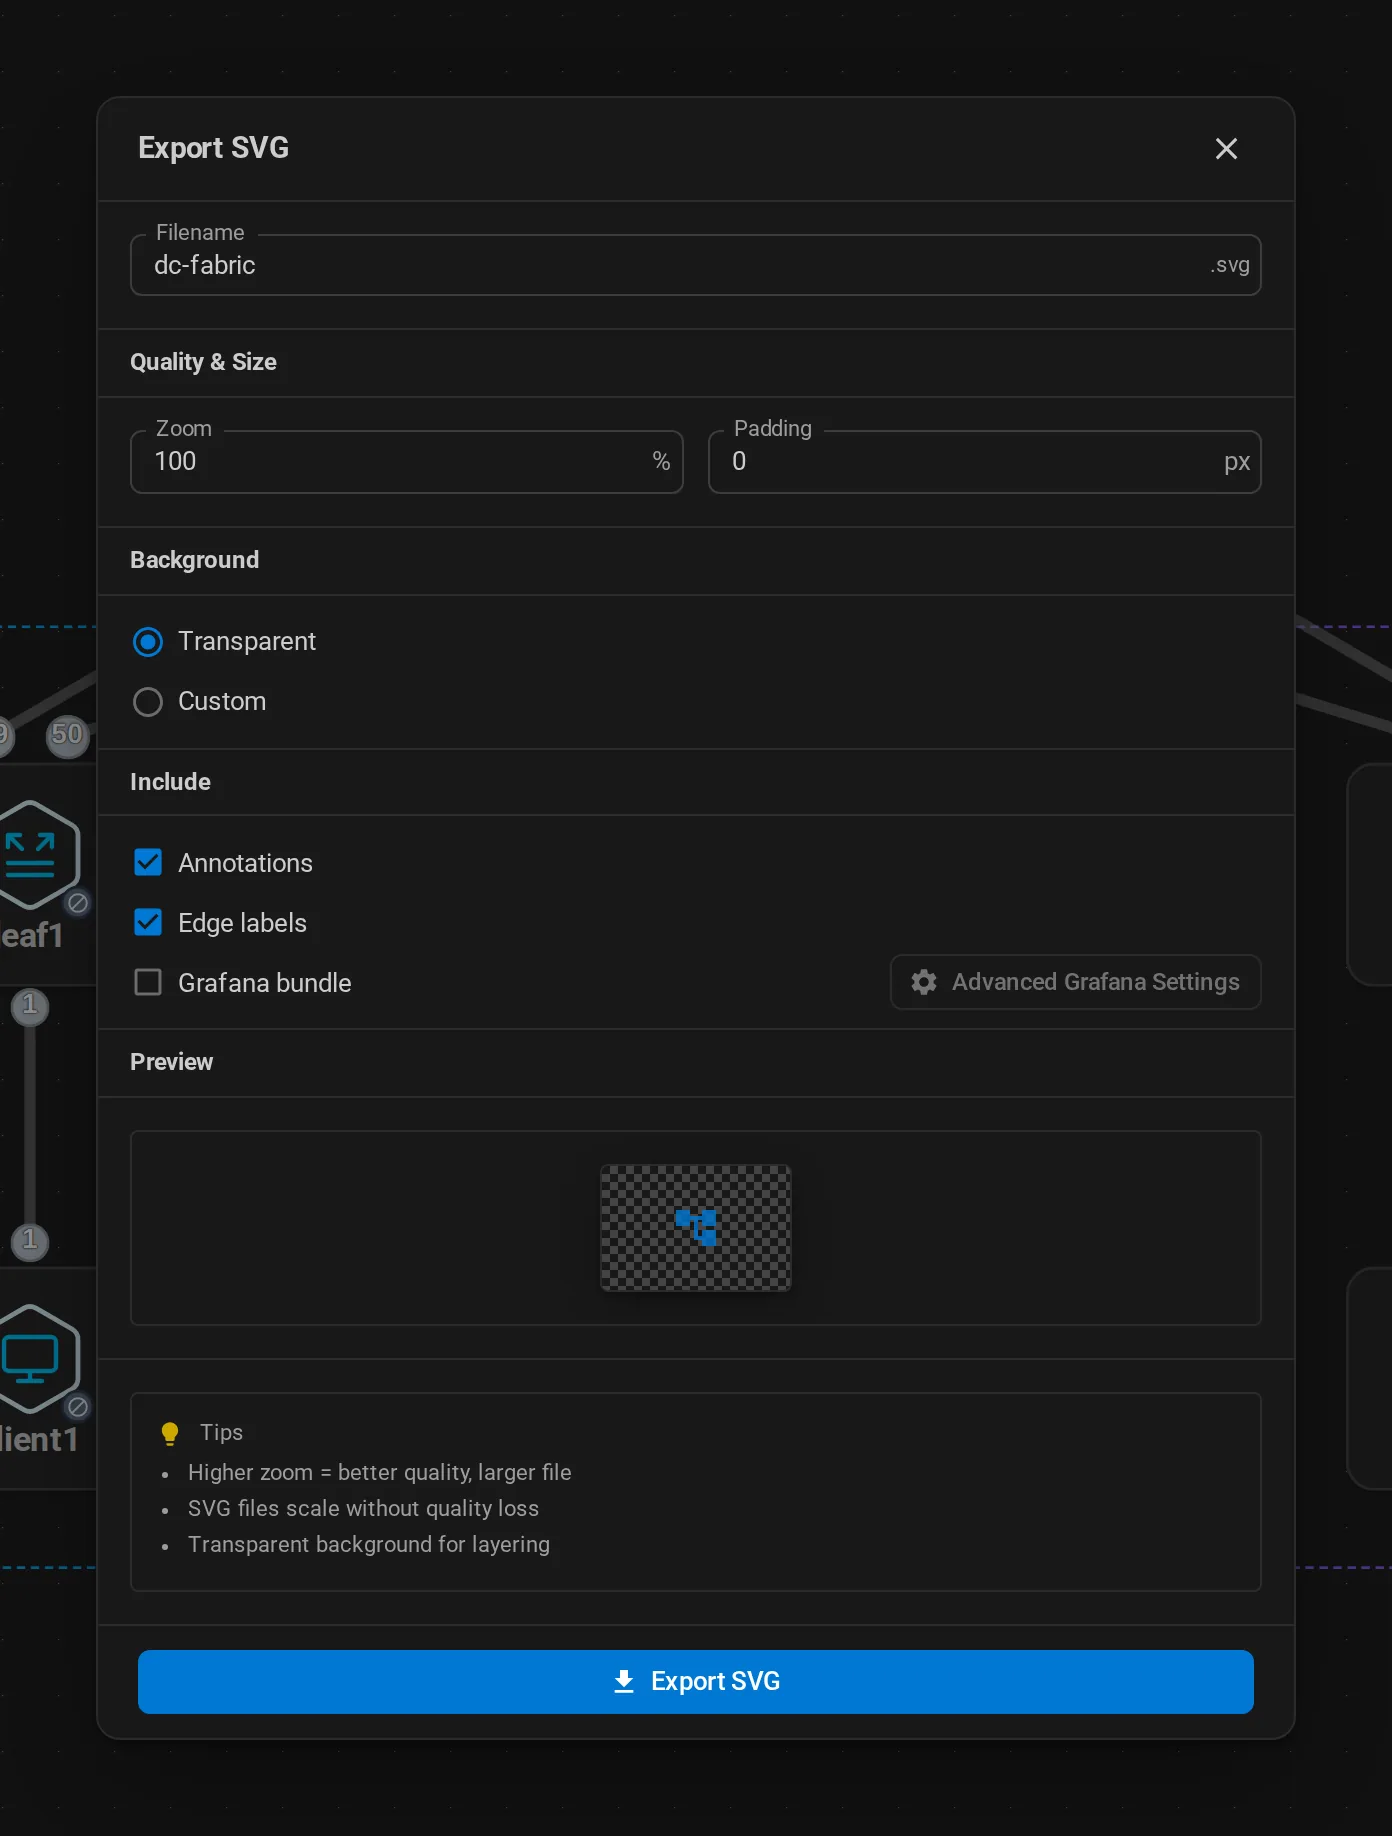
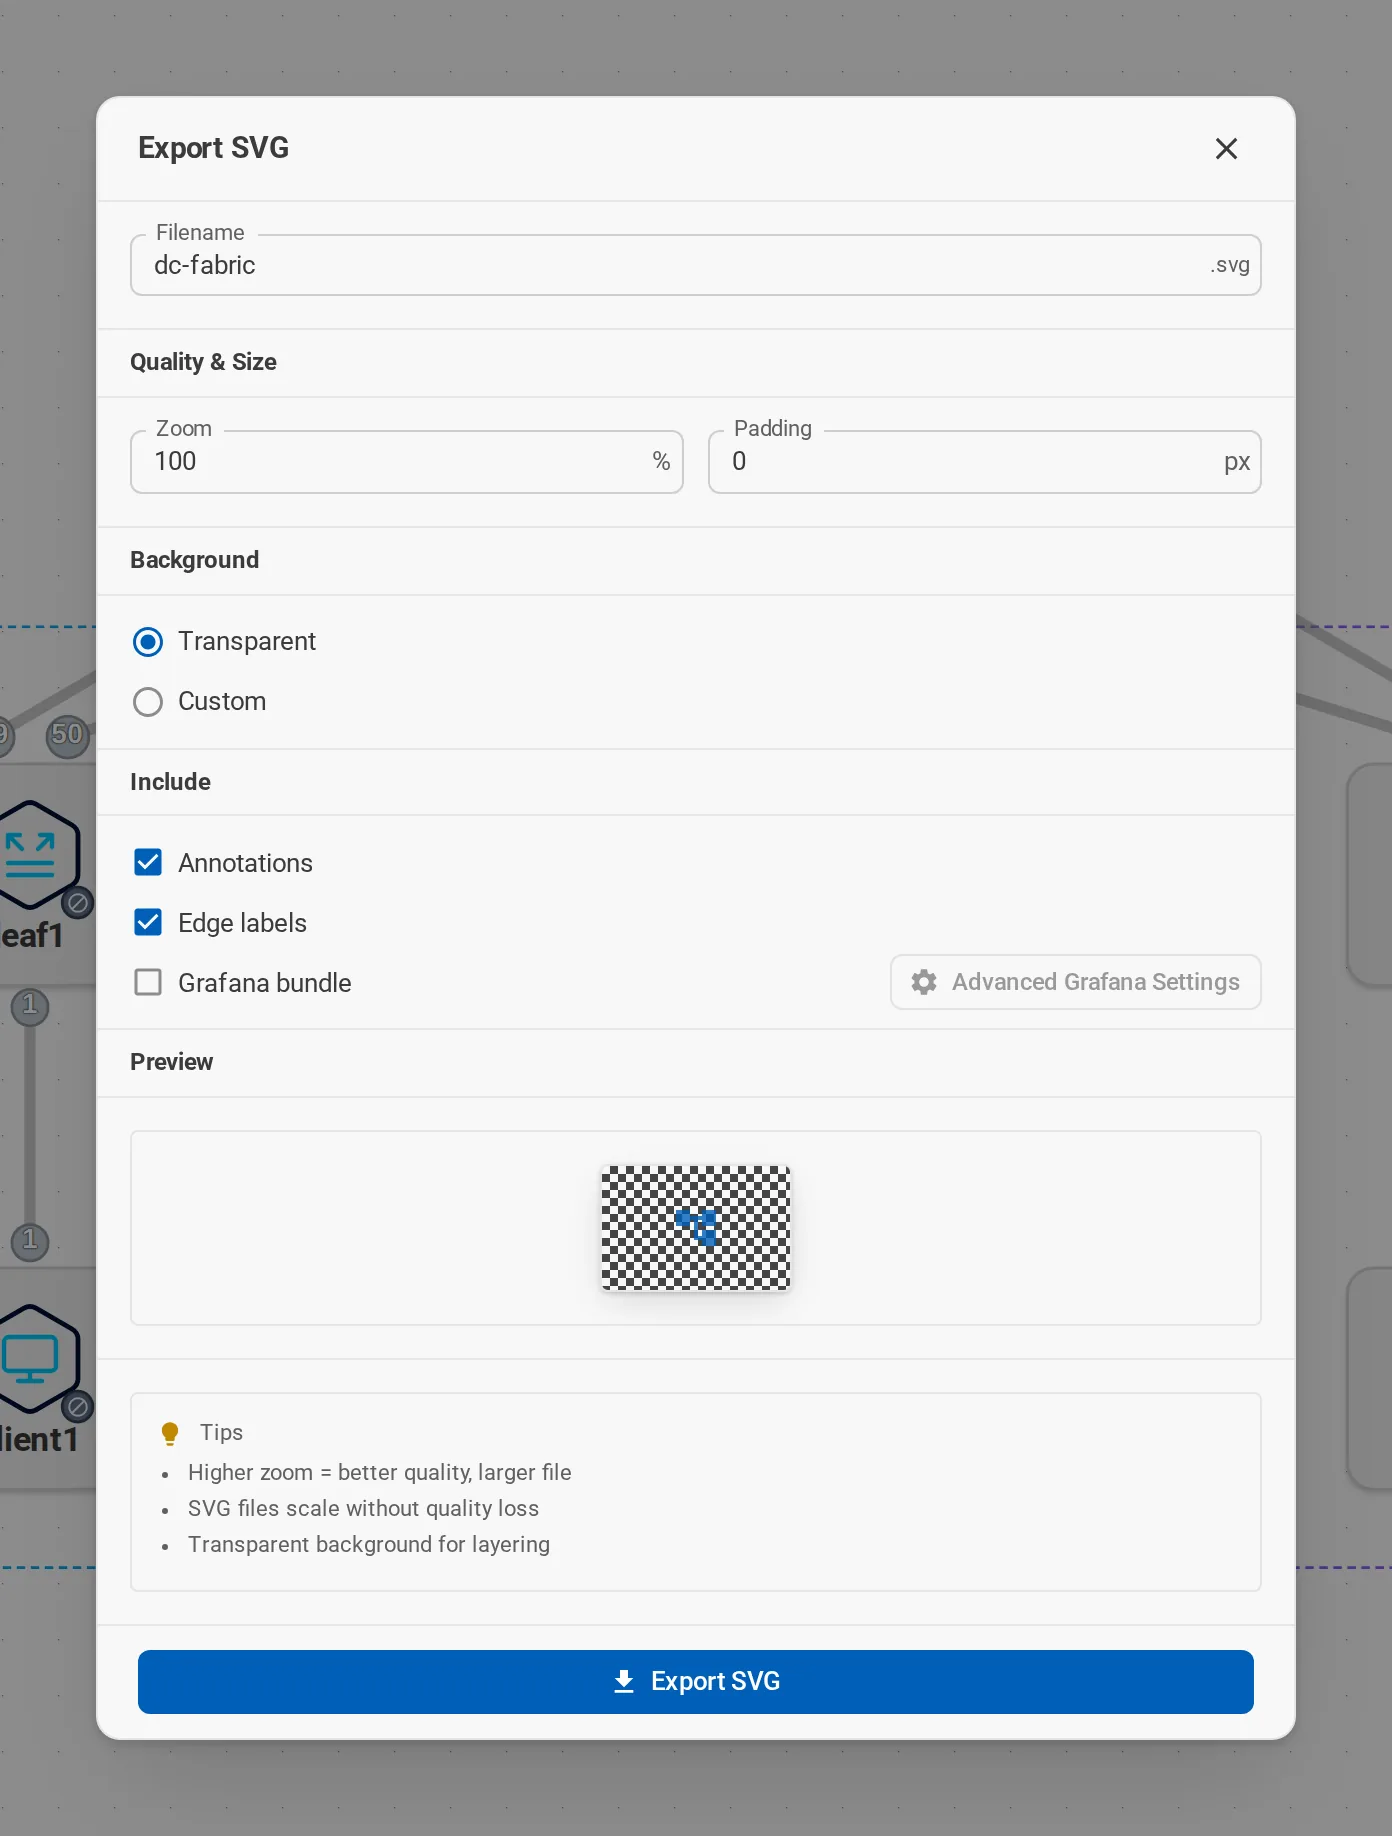
VS Code asks where to save the file. The desktop and web apps download it.
Grafana bundle
Turn on Grafana bundle under Include to get three files for the Grafana Flow panel:
| File | Contains |
|---|---|
<name>.svg |
The diagram, with IDs Grafana can color. |
<name>.grafana.json |
A dashboard with the Flow panel. |
<name>.flow_panel.yaml |
Which metric colors which link, and the thresholds. |
The panel colors links by traffic and interface state, with optional rate labels and a legend. Advanced Grafana Settings set sizes, thresholds, and label shortening.
The bundle is only the picture and the mapping. It expects a Grafana with matching telemetry already set up; it does not deploy one.
Draw.io
The graph actions generate a Draw.io file, laid out horizontally or vertically, for quick documentation. VS Code also has an interactive Draw.io mode. Use SVG when the diagram should look exactly like your canvas.
Interactive docs
The diagrams on this site are the real viewer, reading .clab.yml files. You can do the same in your own documentation: readers pan, zoom, inspect nodes, and download the lab. See Embed the viewer.